RESTalytics — our Node Knockout entry
This past weekend I took part in Node Knockout, a 48-hour coding competition where teams have to build an app in node.js from scratch. On the team were Drew Wilson (design), Kevin Thompson (frontend), and Aashay Desai and myself on the backend. Our entry, RESTalytics, is a sweet-looking analytics dashboard for monitoring REST API usage. We also developed a drop-in library (node-restalytics) to be used with any node.js app to add analytics tracking in one line of code.
Unsurprisingly, the initial idea started out with a huge scope. We wanted to track users as they moved through a site, drill down into GET/POST parameters, including any JSON received or sent by an API, track uptime, slowest API endpoints, and more. Fortunately, we trimmed it down to just the basics: monitoring requests in real-time, tracking average response time, and counting the number of requests.
In 48 hours, a great deal was accomplished, but in the end it turned out that just getting a nice real-time graph working with the proper backend architecture in place took some time. Due to last-minute issues, we weren’t able to show the most popular endpoints or top sources in the dashboard, but hopefully the general idea of the service is clear.
On the third-party API server side, a developer only needs to install the restalytics node module (npm install restalytics), and include this line of code in their main server-side script:
require('restalytics').apiKey('_YOUR API KEY HERE'_);
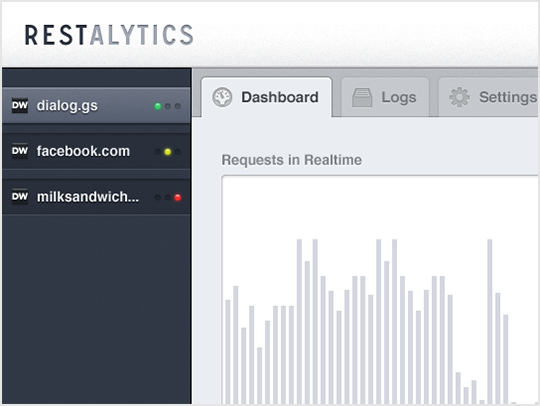
The restalytics module is able to track incoming HTTP requests (to any server subclassed from http.Server) as well as responses. The graph on the main dashboard shows requests on the horizontal axis and response time as their height. The response time is the time required to handle an incoming HTTP request (after it arrives) and send the first HTTP response header. It’s purely the request processing time, not data transfer time.
The restalytics node module, by default, flushes the collected statistics every 5 seconds to the RESTalytics API server. This allows you to see a near real-time view of requests to your server. In case the RESTalytics API ever goes down, the node module is designed to retry. If the API is down is for an extended period of time, the module will drop older statistics to conserve RAM.
The module sends each batch of data points as a POST request to /api/data. Each batch is asynchronously processed by adding each data point into an incoming queue (stored in Redis). A worker process processes each data point, calculates daily and 5 minute averages by storing them into keys in Redis for each type of statistic required (number of requests, average response time, slowest endpoint, etc.). Finally, the actual data point is stored for safekeeping into MongoDB.
MongoDB also contains the different sites (APIs) that a user account may have, as well as all detected URI endpoints. By storing the raw data points in Mongo and issuing dashboard queries directly to Redis, we’re able to maintain acceptable performance with little datastore overhead.
Future improvements:
- Historical graphs
- Browse individual requests (Logs tab)
- Find requests by filtering on query string parameters or request data
To find out more, check out RESTalytics or follow me on Twitter and I’ll keep you updated.